_«Each year, on the first day of class, I walk in and open the newspaper to the financial section. Found there are pages and pages of tables with lots of numbers in tiny print […] posted in these tables is a list of company names, and next to each name is a bunch of prices. “Call out the name of a big, well-known company,” I say. The students come up with companies like General Electric, IBM, General Motors, and Abercrombie & Fitch. Actually, it doesn’t really matter what companies the students shout out. My main point is so easy to make, any company name in almost any industry, large or small, well-known or not, will do. The result is always the same. _
_ […] General Motors sold for $37 per share yesterday. But over the last year, shares have sold for between $30 and $68 […] how can this be? Can the value of General Motors, the largest car manufacturer in North America, change that much within the same year? Can a company that large be worth $30 billion one day and then a few months later be worth $60 billion? Are they selling twice as many cars, making twice as much money, or doing something drastically different in their business to justify such a large change in value? Of course, it’s possible. But what about the big price changes in IBM, Abercrombie & Fitch, and General Electric? Does something happen each and every year to account for large changes in the value of most companies?»_
The Little Book that Beats the Market – Joel Greenblatt
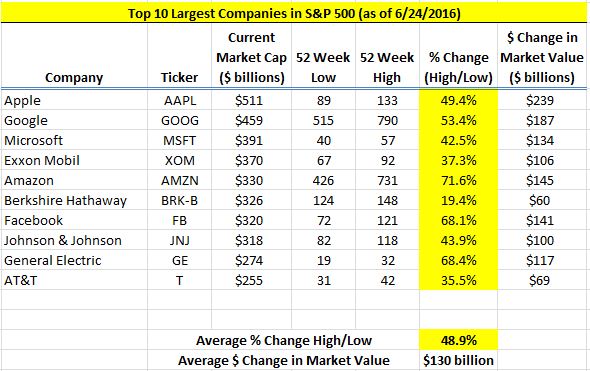
Como ejercicio de curiosidad he decidido profundizar sobre una idea bastante extendida entre los círculos inversores. Dentro de este ámbito se tiene la creencia de que entre compañías de gran capitalización el “mojo” – aquel término utilizado en la parodia protagonizada por el agente Austin Powers – brilla por su ausencia. Para saber si esto ocurre en realidad, si el aburrimiento y la falta de adrenalina forman parte de la naturaleza de este tipo de empresas, he analizado los rangos de precios de las últimas 52 semanas para las cien mayores acciones (por capitalización de mercado) que componen el índice S&P 500 americano. Los resultados pueden verse en esta hoja de cálculo Elefantes.xls (38 KB). La columna “GAP” es la diferencia entre el máximo y el mínimo de 52 semanas para cada acción. A fecha de publicación de este artículo, la mediana de esa discrepancia o GAP se ha situado en el 35,15%.