Blogs, artículos y demás

Dividend Kings Performance
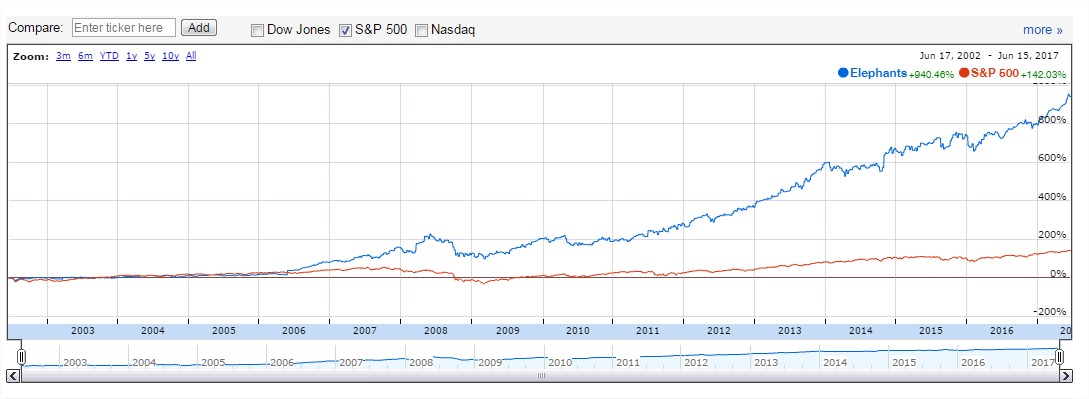
Imagine you had $200,000 to invest 25 years ago at the beginning of 1991. Suppose you put half into the S&P 500 Index and invested the other $100,000 equally across each of the current dividend kings that trade on the major stock exchanges (FMCB trades over-the-counter and was excluded for liquidity purposes).

After making your initial investment in each of the dividend kings, you reinvested dividends (ideally through a dividend reinvestment plan) but did nothing else – no rebalancing, no additional capital contributions. You simply bought and forgot.

From 1991 through 2016, your $100,000 in the S&P 500 Index would have compounded at a 9.8% annual rate and grown to just over $1.1 million at the end of 2016. Not bad at all!

But what about your portfolio of dividend kings?

There is some survivorship bias to this study (i.e. it doesn’t account for dividend kings that ultimately lost their crowns), but the dividend kings portfolio grew from $100,000 in 1991 to reach an outstanding value of $2.8 million at the end of 2016, representing a 13.7% annual return.

Dividend Kings Performance
Source: Simply Safe Dividends

Even better, the portfolio of dividend kings had annual volatility of 12.9%, much lower than the S&P 500’s 17.6% volatility during that 26-year period.

Lower volatility means that the value of your dividend kings portfolio would have fluctuated less than the value of your portfolio holding the S&P 500 Index.

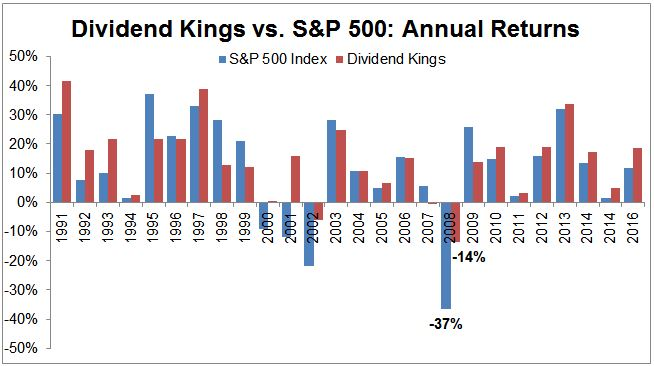
As seen below, the dividend kings significantly outperformed each of the four years that the S&P 500 Index (represented by the blue lines) declined in value. For example, the dividend kings portfolio returned -14% during 2008, easily beating the S&P 500’s total return of -37%. Dividend kings are generally high quality businesses with defensive characteristics that serve them well during bear markets.

Dividend Kings Annual Returns
Source: Simply Safe Dividends

Of course, the performance data above contains a good deal of hindsight bias. After all, who can predict which of the current dividend kings will be able to continue increasing their dividends for the next 25 years?

However, the information does illustrate the correlation between companies that are able to consistently raise their dividends and the value they create for shareholders.

Best Performing Dividend Kings
The best dividend kings from 1991 through 2016 were Lowe’s (LOW), Lancaster (LANC), and SJW Group (SJW). These stocks generated annualized returns of 20.3%, 17.7%, and 15.0%, respectively.

Impressively, each of these dividend kings still maintains a payout ratio less than 50%, leaving plenty of room for them to continue increasing their dividends for years to come.

Worst Performing Dividend Kings
From 1991 through 2016, only one dividend king meaningfully underperformed the S&P 500 – Vectren Corporation (VVC). Vectren is a utility company that primarily provides energy delivery services to natural gas companies located throughout Indiana and Ohio. This dividend king’s stock compounded at an 8.1% annual rate from 1991 through 2016, trailing the S&P 500’s annual return by about 1.7% per year.

All of the other dividend kings compounded faster than the market, although Tootsie Roll (TR) generated a return in line with the market (9.5% per year).

Fastest-Growing Dividend Kings
The fastest growing dividend kings, as measured by annual sales growth over the last five years, are Nordson (NDSN), Cincinnati Financial (CINF), SJW Group (SJW), Lowe’s (LOW), and General Parts (GPC). Their sales have compounded at annual rates of 8.0%, 7.5%, 7.3%, 5.3%, and 4.2%, respectively. After more than 50 years of dividend growth in the bag, these growth rates are remarkable.

Interestingly, only two of these dividend kings are also in the top five when ranked by fastest dividend growth over the last five years. Lowe’s (LOW), Hormel (HRL), Nordson (NDSN), 3M Corporation (MMM), and Parker-Hannifin (PH) have compounded their dividends the fastest at annual rates of 20%, 18%, 17%, 15%, and 12%, respectively.

Aside from 3M Corporation, none of these dividend kings had payout ratios greater than 40% as of 12/31/16, suggesting they have plenty of room for continued dividend growth.

Sector Mix of the Dividend Kings List
Analyzing where each of the dividend kings comes from can be quite insightful. By equal-weighting each of the current 22 dividend kings, we were able to compose the sector mix of the dividend kings list and compare it to the S&P 500.

As seen below, not a single technology stock is to be found in the list of dividend kings. The rapid pace of change and continuous need to invest for growth make consistent dividend payouts less common in this sector. Warren Buffett is notorious for refusing to invest in the technology sector (see his entire dividend portfolio here) because he is uncomfortable forecasting the fast-changing industry’s dynamics several years out.

The consumer staples, industrials, and utilities sectors are weighted much more heavily in the dividend kings list than they are in the S&P 500 Index. These sectors evolve at a much slower pace, providing a more attractive environment for long-term dividend growth.

Dividend Kings Sector Mix
Source: Simply Safe Dividends, Standard & Poors

1 me gusta

En unos 2 años …osea con 27 añitos …los dividend kings darán más por dividendos al año que la cantidad que se invirtió originalmente.

Claro…hay que descontar las retenciones (de los dividendos) …pero no esta mal …por tener un puñado de las superaburridas PG,KO,CL,HRL,LOW,MMM.

Y no ,pescanova no aparece por ningún lado… y no , no conozco a nadie famoso con esa cartera,jeje.

la bajada de 2008 es llamativa,14%

Está claro que los gypsy kings son una excelente inversión (dividends, perdón). Pero luego miras el cargo del banco y…
Dividendo Umanis importe bruto origen 450,60
Retención origen 30% -135,18
Retención IRPF 19% - 59,93
comisión gestión - 3,83
Total 250,86
Le hacen esto a Buy&Hold2012 y llama a Trump para que envie la VI Flota a impartir justicia
Menos mal que no miro los divis a la hora de invertir.

2 Me gusta

Jejeje… todavía me estoy riendo!

El 30% en origen solo lo hacen los piratas…pero en Suiza es el 35%… uno de las pocas pegas que le pongo a Nestle…Dinamarca y Suecia por el estilo.

Usa si se rellena el WBEN es el 15%.

UK es 0% de retención en origen…para grandes cantidades hay retención (no se exactamente)…me encanta BATS y RB.

Comisión de gestión,ING 0 si se hace una compra al semestre (estoy empezando con estos,le contaré)

1 me gusta

El otro día “jugando a las carteras”, hice una cartera de seguimiento en Google Portfolio, le di fecha de inicio allá por 2002 para incluir la caída de 2008. La gráfica comparada con el S&P500 es abrumadora, y sorprende porque siempre está en mente la dificultad de batir a los mercados.
La pregunta es si serán las próximas décadas igual a las pasadas, pero con un mundo con gente pasando de la pobreza a la clase media y energías alternativas en el futuro… imaginan que un día el ser humano logra generar energía por fusión nuclear.

Tal vez sean solo “quijotadas”, o tal vez no.
Lo que tengo claro es que a largo plazo acumular patrimonio, en grandes empresas, funciona.

La cartera está formada por (contiene una acción de cada empresa):

Seguro que a @quixote1 le gusta :sunglasses:

1 me gusta

Suele funcionar si uno tiene la paciencia de ver como en según que ciclos parecen funcionar mejor otras cosas.

Luego uno también puede tener la mala suerte de pillar una época como los 70 donde parecía que este tipo de inversión era lo de moda con los siguientes retornos relativamente bajos durante algunos años.

1 me gusta

Esas 6 pata negra, compradas poco a poco ,todos los años cuando bajan temporalmente es una de las mejores estrategias que conozco .

Se podrían añadir otras 6 o 10 para tener suficiente diversificación …quedan unas cuantas buenas fuera…

Los años 70 serían flojos para estas pero me imagino que lo recuperarían en los 80-90…creo que es dificil hacerlo mal con estas…en cualquier década.

A veces nos complicamos la vida innecesariamente.

Los retornos bajos durante algunos años (que pueden coincidir con retornos espectaculares en otras compañías) es lo que en mi opinión hace verdaderamente difícil el B&H. Y esto va a ocurrir seguro (haciéndole a uno pensar que es un zoquete). Algunas veces durante mucho, mucho tiempo. Aunque parezca una broma: es complicado ser perezoso (en esto).

@Ecijo22 muchas gracias por la información sobre GAMR. A pesar del relativo poco volumen y baja capitalización lo he añadido a mi radar (dentro de las apuestas “poquito a poco”)

1 me gusta

amazon OPA whole foods con una primera del 27%, y el resto del mercado del consumo cae a plomo (target, walmart)

Por si alguno no conoce whole foods, os dejo una entrada que hice hace 2 años desde mi óptica de cliente en una viaje a usa que hice

Interesante el post del blog Estratega Financiero

El post original aquí
https://estrategafinanciero.com/balance-operadores-bolsa-de-nueva-york-nyse/

1 me gusta

Igual conviene aplicar un poco de pensamiento de 2º nivel…

  1. “a efecto de dato no se puede trabajar” - bueno esto es 1er nivel jeje
  2. tenemos la ingente cantidad de 4 experimentos, con un resultado de 50% de efectividad (¿alguien tiene una moneda?)
  3. Si se hubiera utilizado la señal allá por 2013 que es cuando da así “a ojo”, ni para pipas vamos. Y ya no le digo si “promediamos”

Vamos un caso claro de “voy a ver lo que quiero ver”. Estoy seguro de que cualquiera de nosotros es capaz de encontrar series de datos totalmente irrelevantes que muestran la misma correlación o superior a la propuesta.

Todo lo de arriba no quiere decir que no valga. Sólo que no hay ninguna evidencia.

5 Me gusta

“Cryptocurrency miners use graphics cards from AMD and Nvidia to “mine” new coins, which can then be sold or held for future appreciation”

No tengo simpatia por las technologicas, pero si acaban con la banca tradicional (al menos la española) estoy dispuesto hasta a hacerme accionista. Me cuesta imaginar un sector que se merezca más desaparecer del mapa.

1 me gusta

Que bueno, me meto en TNK, y resulta ahora que las buenas son TK y TGP, esto de los holdings es un lio. Menos mal que mi madre se entera aún menos que yo.

1 me gusta

A mi madre le cuesta distinguir entre el dólar y Berkshire …literal.

Solo cuando sale Buffett en la tele suelta: Tiene cara de listo!.

Pero a lo que voy…en los últimos 5 años lo hace bastante mejor que el que escribe (osea berkshire y el dolar).

1 me gusta

Fíjese si es listo el bueno de Buffett que hoy ha entrado con 400 millones en Home Capital Group, uno de mis bancos preferidos y lo ha hecho subir un 27%.

Pues si.

Y estaba barata…y no tenía nada…y no por falta de ganas.